
2004-2005 Data Collection and Refining
the System
 Fall 2004 marked the beginning of
college-wide data collection. Each instructor was responsible for
incorporating the stated general education and transfer or career
goals into individual courses. Using the digitally stored data form
from the Assessment Folder, each instructor was also responsible
for reporting the data collected by the chosen instrument, as well
as translating that data into the more generalized criteria for
success, which allow for aggregation of the data at the discipline
and area levels.
Fall 2004 marked the beginning of
college-wide data collection. Each instructor was responsible for
incorporating the stated general education and transfer or career
goals into individual courses. Using the digitally stored data form
from the Assessment Folder, each instructor was also responsible
for reporting the data collected by the chosen instrument, as well
as translating that data into the more generalized criteria for
success, which allow for aggregation of the data at the discipline
and area levels.The Core Team was pleased to report that 100% of the full-time faculty of the College completed this first collection and reporting cycle by January 2005. Examination of the data collected began in earnest in Spring 2005. Areas met during the spring in-service to discuss their findings from fall and to make area-level recommendations for improvement. These data sets are housed digitally in the Assessment Folder, under 2004-2005 assessment projects.
5 Some assessment events resulted in multiple changes, so percentages for the total report exceed 100%.Transfer and Career Results:An examination of the data reporting sheets from the 2004- 2005 assessment cycle reveals several trends:
- Instructional Changes: 52% of assessment events resulted in instructional changes (from most to least frequent):
-
- Varying delivery style to accommodate diverse student learning styles
- Modifying course content to align more seamlessly with the course objectives
- Implementing review sessions for areas of perceived student need
- Implementing exams in course sequences to facilitate transfer
of skills throughout a program of studies
- Instrument Changes: 48% of assessment events resulted in instrument changes (from most to least frequent):
-
- Modifying the instrument to focus on just one or two specific objectives
- Creating more authentic assessments which measure application rather than recall
- Creating common area objectives to facilitate aggregation
- Creating assessments which reflect individual instructor preferences
- Creating common rubrics and samples to increase
objectivity
- Curricular Changes: 19% of assessment events resulted in additional curricular recommendations (from most to least frequent):
-
- Creating communications prerequisites for higher-level content courses
- Encouraging students to complete general education courses early
- Examining the potential of co-requisites for career courses
- Computer Science:
In CIS 106, students were losing points on lab assignments due to insufficient math skills. I have subsequently added a math review unit covering specific business math concepts addressed in this class. Students also are assigned math problems to solve using Excel and these are reviewed in class.
- Nursing:
Redesigned time allotments for topics. Historically, a separate class time was devoted to math review and a separate class time was spent on the metric system review. This left only one class time to utilize for the more difficult intravenous calculations.
The change that was made is as follows: The math review and metric system review were combined and addressed during one class period. This allowed two class periods to be utilized to address intravenous calculations.
I have found that the assessment process enables us to get out of the rut of identifying a need, but not getting it fixed or met. With the assessment process needs are identified and concrete plans are created and implemented to meet the need. We are able to progress.
- Nursing:
I have created a delegation project that will place each RN student as a “charge†nurse being responsible for assignments of other RNs, LPNs and CNAs. This project will be graded and will provide students with insight and an activity to promote critical thinking. The topis of delegation was very heavy on the past state board exams and will also respond to previous students’ desire to have more involvement with this topic.
During the assessment of student performance, I have been hit between the eyes with how poorly my RN students performed math functions. These assessment findings have demonstrated the need to focus on this aspect of nursing.
- Mathematics:
MAT 203 Had students use Newton's method to solve problems in class and on exams using their graphing calculator. This was partly in response to departmental discussions on the importance of students demonstrating competence with technology.
MAT 110 Introduced story problems involving fractions in a pictorial way as a result of department discussions emphasizing the importance of problem solving.
- Art :
Rubric was created for the written assignment in art history. Copy of the rubric was returned with the written assignment with grading on the rubric scales. [Since using the rubric to score these assignments] I have decreased the time between making the museum visit (observation) and the written description of that observation. I have added more maps of a historical nature, so that students have a better sense of location and the historical environment in which a work was created.
- Communications:
The assessment process and tasks forced the SPE and ENG divisions to meet more often/regularly, which encouraged dialogue about best practices, calibration of grading speeches and essays, addressing plagiarism issues, and other departmental issues.
I have used more examples of sound thesis statements and more in-class exercises for students to practice writing thesis statements, thus getting more direct feedback to enhance students understanding of how to write effective thesis statements
The department decided to focus on thesis statements because from our rubric and from our general education discussion it became clear that students were having trouble concisely taking a position or narrowing a topic. We created a new thesis sentence specific rubric for the communications area, which helps instructors plan better instructional activities for the purpose.
This anecdotal evidence confirms, as effectively as the quantitative results reported, that faculty are using the system to create positive change in student learning practices, and that faculty are reflecting upon the system itself, and how it has changed their approaches to teaching.
General Education: During the first collection cycle, the General Education Subcommittee aggregated general education data for all six of the institutional competencies as much as was possible, considering the wide variations between sample size and instruments. Based on a subsequent survey of the data folder, percentages reported below are estimated based upon individual assessment events measures and criteria of success:
- Math:
Fall 2004 - 253 students sampled, with an average rate of 20% of students unsuccessful.
Spring 2005 - 212 students sampled, with an average rate of 32% of students unsuccessful. - Ethics-
Fall 2004 - 37 students sampled, with an average rate of 31% of students unsuccessful.
Spring 2005 - unclear student percentage due to insufficient data. - Research-
Fall 2004 - 50 students sampled, with an average rate of 12% of students unsuccessful.
Spring 2005 - 51 students sampled, with an average rate of 29% of students unsuccessful. - Communications-
Fall 2004 - 359 students sampled, with an average rate of 36% of students unsuccessful.
Spring 2005 - 434 students sampled, with an average rate of 20% of students unsuccessful. - Problem Solving-
Fall 2004 - no students sampled
Spring 2005 - 132 students sampled, with an average rate of 35% of students unsuccessful. - Technology-
Fall 2004 - no students sampled.
Spring 2005 - 113 students sampled, with an average rate of 14% of students unsuccessful.
A preliminary examination of these data suggested that coverage
was not complete. The committee discussed the definition of a
general education program, and agreed that while the College
catalog distinguishes courses that are designated “general
education, the committee felt that a general education program is
a philosophical commitment to ensuring all students are exposed to
the skills which faculty chose as essential. Thus the committee
felt that a more broadly-drawn portrait of general education could
be garnered by sampling objectives in courses across the
curriculum. To that end, and in order to ensure adequate sample
size, the general education subcommittee proposed a cycle of
assessment which examines two of the six competencies each year.
Faculty report on specific competency objectives and record their
assessment results on checklists which standardize the criteria for
success. ![]() Reporting templates
from individual instructors are stored in the Assessment Folder and
aggregated to provide a comprehensive look at the institution in
order to facilitate discussion and plans of action.
Reporting templates
from individual instructors are stored in the Assessment Folder and
aggregated to provide a comprehensive look at the institution in
order to facilitate discussion and plans of action.
CAAP: Another important aspect of the
assessment plan is the collection of data from external, normative
sources. The most significant of these sources is the yearly CAAP
testing procedure. During the 2004-2005 school year, two faculty
forums were convened to discuss previous years's CAAP data. ![]() Faculty agreed
that although alignment of the stated CAAP competencies to the
competencies defined in the general education program is only
partial, having an external measure by which to compare the skills
of Sauk's students to other students across the nation is valuable.
An effective system of assessment cannot rely solely on the
interpretation of internal measures of success by those with vested
interests in the success of the institution, but should be balanced
by the systematic and impartial comparison of those students to
other students at similar institutions. As a result of the initial
examination of previously-collected CAAP data, faculty felt it was
important to establish a testing schedule which would allow for a value-added analysis, that is, testing incoming freshman and
having them take the same test after completion of 45 hours. It is
planned that such data will afford faculty and other stakeholders
with objective information about the progression of student
learning on campus.
Faculty agreed
that although alignment of the stated CAAP competencies to the
competencies defined in the general education program is only
partial, having an external measure by which to compare the skills
of Sauk's students to other students across the nation is valuable.
An effective system of assessment cannot rely solely on the
interpretation of internal measures of success by those with vested
interests in the success of the institution, but should be balanced
by the systematic and impartial comparison of those students to
other students at similar institutions. As a result of the initial
examination of previously-collected CAAP data, faculty felt it was
important to establish a testing schedule which would allow for a value-added analysis, that is, testing incoming freshman and
having them take the same test after completion of 45 hours. It is
planned that such data will afford faculty and other stakeholders
with objective information about the progression of student
learning on campus.
Two institutional reports on the CAAP testing process have been
issued by Information Services. :
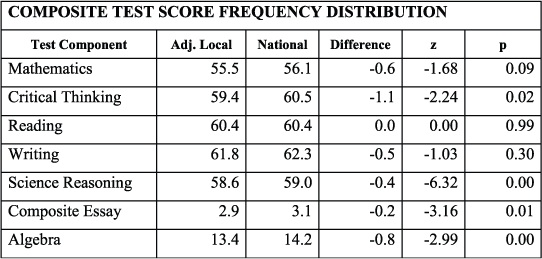
- Fall 2005 data: The most recent shows the results of SVCC's incoming freshman as compared to its peer group nationally. This group of students is the first who were tested in the required PSY 100 orientation course, and who will be re-tested for a value-added analysis after completion of 45 hours. The scores reported below, then, currently represent the baseline of the new value-added testing system:

Conclusions: The average test scores for entering freshmen at Sauk Valley Community College are less than the national norm in every category of the CAAP exam except reading. These lower scores are statistically significantly different in the areas of critical thinking, science reasoning, and essay writing.
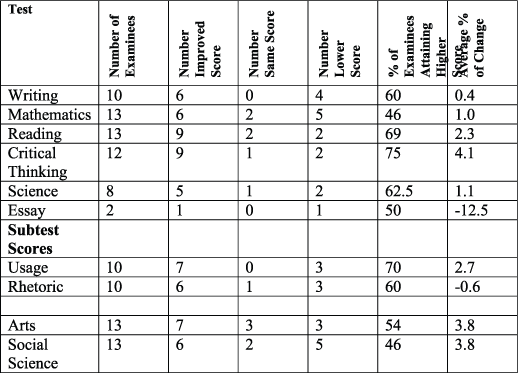
- Spring 2005: Another CAAP analysis, dated May, 2005, shows the results of the first test/re-test cycle, which was completed by identifying students who had previously taken the CAAP test and completed at least 45 credit hours prior to the spring semester. A total of 58 exams were completed by students. A summary of those results are as follows:
-
- Only two students completed the Spring Essay test; therefore the sample size is too small to make any inferences.
- On the remaining exams, at least 46% of Sauk students retaking the exam scored higher. Critical Thinking and Science exams showed that over 60% of the students attained higher scores. Math was the lowest at 46%.
- The rate of change on all exams was positive in all instances except the statistically insignificant sample Essay exam.
- There were significant positive differences in scores on both the Reading and Critical Thinking exams as evidenced by statistical analysis using a paired T-test and computing P-values for each exam.


After the discussion and reporting of the first cycle results as shown above, the second data collection cycle began for the College in Spring 2005. Changes were implemented, new objectives measured, and assessment techniques refined. Having completed two successful collection cycles, the Core Team felt the system was practical and sustainable, and created a policy manual in the form of the Sauk Valley Community College Assessment Plan (see Appendix N), which gives an overview of the assessment process, details the threads which contribute to the system, indicates responsibility for the continuation of the process, and links the data flow from academic assessment to strategic planning.


