The System


The System
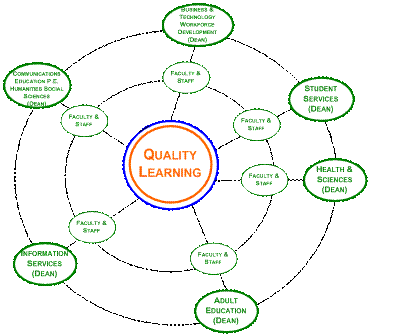
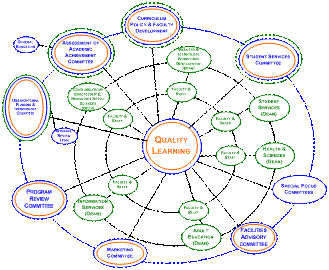
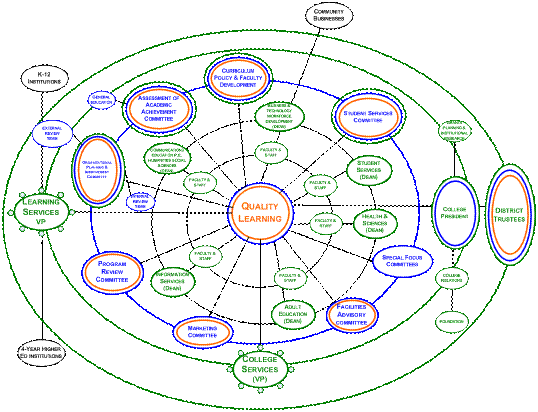
Recognizing that the philosophical shift to a learning college is inevitably paired with a commitment to a system of documentation, accountability, and cyclical reliability, various task force groupings reviewed, revised, and approved the proposed design of new relationships among sectors of the College. The resulting foundational shift in Sauk Valley's system is illustrated in the Organizational Planning and Improvement System Chart (a graphic known locally as the Orbit. It transforms the linear authority of organizational charts and lists of committees into a round table of interrelated faculty and staff positions, academic and support areas, and committees. Quality learning for students lies at the center, and the oversight of the Board of Trustees encircles the whole system. Stakeholder relationships are directed into appropriate areas of the College community.In undertaking the complex design of relationships among sectors of the College, the Organizational Planning and Improvement System Chart provides a conceptual map from which data flow, accountabilities, and timing can be brought into relationship, ensuring coherency. To understand how the resulting orbital foundational depiction transformed the linear organizational chart is to understand the transformation of the institution's culture and the context in which new strategic planning and academic assessment initiatives developed.

(i) The system centers on the College's mission
of equality learning, where students reside as the central guiding
principle, represented by the central image in the chart.

(ii) Most directly effecting student learning from a variety of discipline and program perspectives are the faculty and staff and the Deans, separated into various program and service areas. These form the inner rings of the learning system chart.
Â

(iii) In a learning college, the work of individual faculty and staff is part of a larger “learning organization†that communicates, analyzes data, and makes decisions in a team setting. In the Organizational Planning and Improvement System Chart, this feature is represented by additional rings representing the revamped committee structure, connecting all of the committee charges to the mission of quality learning.

Illustration 2: Organizational Planning and Improvement System
Chart
(iv) In the final form of the model,
administration and the Board of Trustees form the outer,
all-encompassing rings of the institution; and stakeholders outside
the institution are shown linked to an appropriate gateway for
their concerns to be communicated into the institution. A
full-sized version of the Organizational Planning and Improvement
System Chart is in Appendix A.


